Sometimes beautiful data is only skin deep
5/23/13 / David Kennedy

We’ve been talking a lot about the importance of conveying data visually lately (ok, and not-so-lately…here are posts from 2008 and 2011), and you have no doubt recently heard a thing or two about big data.
And while we love beautiful infographics, and the power of big data (and medium data), we must be careful not to get sucked into the beauty of the representation of the data and forget to look deeper.
![]()
Take the recent State of Pet Health report from Banfield Pet Hospital. It’s an excellent case of using existing, internal data to answer questions that may not otherwise be easily answered, or even asked. Their website is great at conveying results and allowing you to interact with the data to drill down to what is of interest to you. However, broad findings, often covered in the media, can mislead.
For example, the data is drawn from Banfield’s hospitals. And while they are the biggest hospital (by number of locations) around, that doesn’t mean they’re representative of all pets or geographies. A quick look at Banfield locations in Colorado shows locations only along the Front Range (the more urban areas) and one in Grand Junction. Pets in rural and mountainous areas are likely not represented. Therefore the findings aren’t necessarily by state, as they report, but really by urban areas. More broadly, it only represents pets that see a veterinarian so states with low veterinarian usage rates will have even greater biases in their data.
Or take the recent story on NPR, “Whom do you hang with?” that tracks connections and mobility via data from the Where’s George website. It’s a potentially very interesting use of data that has perhaps little other benefit. However, beyond the potential bias from who is entering the data, as one astute commenter pointed out, the lines on the map aren’t necessarily reflecting individual mobility and connections, but rather the areas for the Federal reserve banks (i.e., so the money is moving around as a result of the Fed, not necessarily people travelling). So while the story claims one thing, the underlying data really says another.
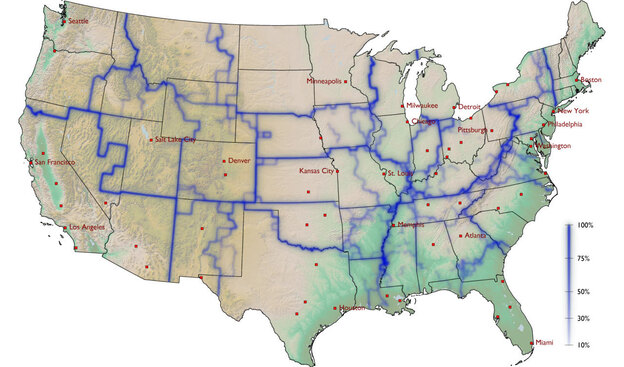
Map created from data collected on Where's George.
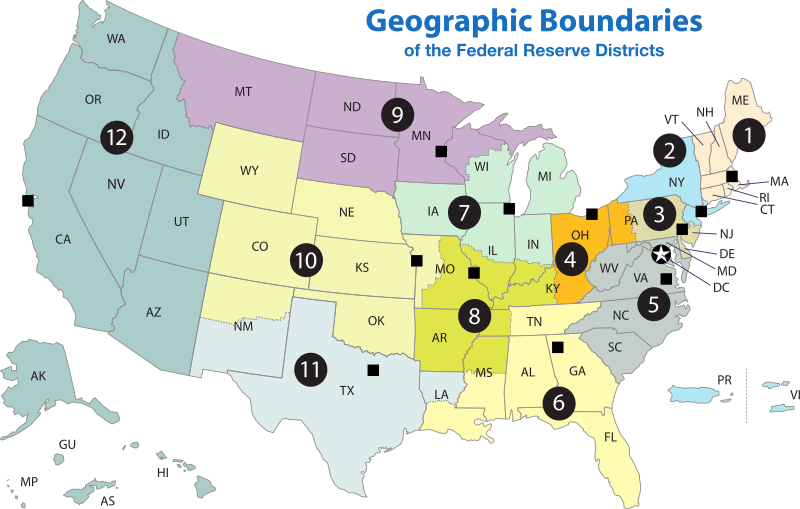
Map of Federal Reserve Districts
Of course, to collect even better data there would be significant costs involved and maybe this is “good enough” in the cases of pet health and understanding social connections. But the need to understand what’s underneath the aesthetics is just as important – and arguably more so – than just seeing the story it seems to tell.
When reviewing any data, it is important to be an informed consumer. Here are five questions to ponder the next time you’re looking at that beautiful data.
- What was the original goal in collecting the data? (Can the data be used for other goals?)
- Who collected the data? (Would it bias the results?)
- How was it collected? & What was collected? (What may have been excluded?)
- What other factors could have impacted the data? (Is it really measuring what you want to measure?)
- When was it collected? (Is it still current?)