Using ROAM to Improve Survey Research
2/10/25 / Matt Bruce

We conduct a lot of community surveys, and we always want our profile of survey participants to reflect the broader population.
In some communities this is easy – we simply invite a random subset of residents and achieve a reflective profile of responses. But in other communities, especially where there is high contrast among neighborhoods, it’s not that easy.
The challenge is this – response rates to a survey differ by neighborhood based on the characteristics of the people who live there. We usually achieve the highest response rates in neighborhoods with high levels of household income, education, and homeownership. On the other hand, we tend to receive fewer survey responses than expected in neighborhoods with lower income, less education, and more renters.
What can we do to fix this problem so that we do not miss the important voices of the most vulnerable residents? How can we ensure survey results represent all people, not just those with the most time or resources?
One way is to send disproportionately more survey invitations to neighborhoods where we anticipate lower response rates. But how do we identify these neighborhoods? We leverage the Response Outreach Area Mapper (ROAM), an online application provided by the U.S. Census Bureau. The process looks like this.
- We use ROAM to identify neighborhoods where we expect lower response rates.
- We send survey invitations throughout the community, but we invite relatively more people living in the hard-to-survey areas.
- We collect responses from people living throughout the community.
- When we review the results, even if we have a lower response rate in some areas, the proportion of responses will more closely reflect the proportion of the community living in each neighborhood.
- Our report shows how the survey results reflect the true population.
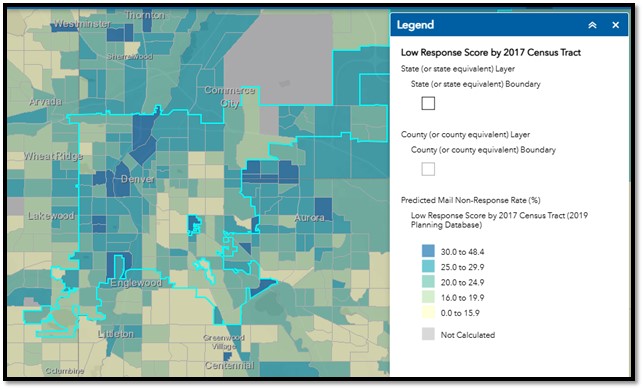
The map below shows what the ROAM application looks like. Using the City and County of Denver as an example, we see that response rates are predicted to be lower (dark blue on the map) in neighborhoods near downtown such as Sun Valley, Five Points, and Globeville, and in the Westwood neighborhood along South Federal Boulevard. In a survey of Denver households, we would be sure to oversample (i.e., send extra survey invitations) these neighborhoods.
Using ROAM to improve our survey sampling is just one of the many tools that we leverage to ensure our survey results are robust, representative, and reliable. Give us a call or send us a message if you’d like to learn more about how we could help conduct a survey of your population.