25 Years of Change – Sensory Disabilities
11/15/24 / Corona Insights

As Corona Insights arrives at our 25-year anniversary we’re looking back to see how our home state has changed over that time*. Included in this series are the following topics:
- Population and Age
- Citizenship Trends
- Sensory Disabilities (this article)
- Physical Disabilities
- Cognitive Disabilities
- Personal Care Disabilities
*Due to data availability the actual period examined in these posts is 2000 through 2022.

Photo by Annie Nyle on Unsplash
Measuring Disabilities
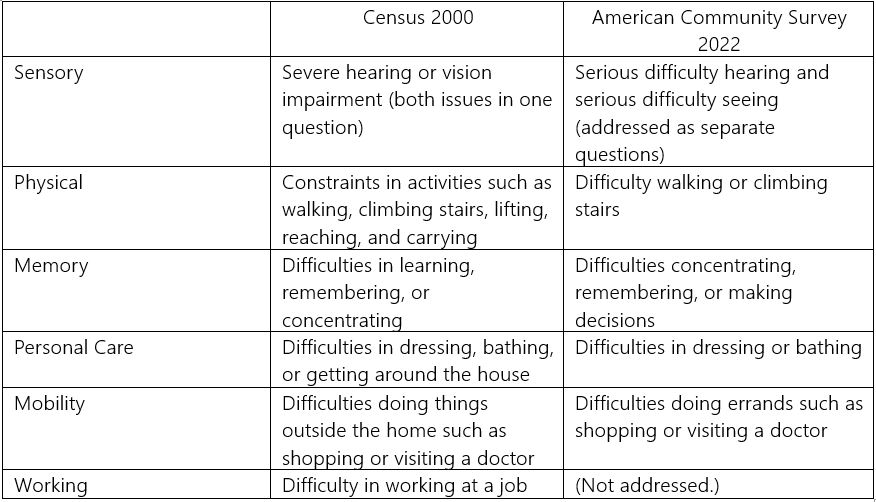
There are a number of ways to describe and report disabilities, and the US Bureau of the Census has revised their approach over the years. We can see the different methods below.

As we can see, there have been a few changes that require some latitude when comparing statistics over time. But the general themes remain consistent, other than removing the question about the ability to work. So let’s take a look at the trends we’ve seen in the first of these issues – sensory disabilities. Other blog posts will address other disabilities.
Sensory Disabilities have Risen
When examining disabilities related to vision and hearing, we will combine the two measures since we’re limited by the combined reporting of the 2000 Census.
The change over the past twenty years has been huge, with the raw number of Coloradans with this type of disability nearly doubling. While some of this is due to the growth of the population in general, we also see that the prevalence of these disabilities in the population has increased markedly, from 3.9 percent of the population to 5.1 percent of the population.

As a footnote, we see that there were 213,000 people reporting hearing disabilities in 2022 along with 123,000 reporting visual disabilities. These add up to more than the 298,000 total because some people report both disabilities.
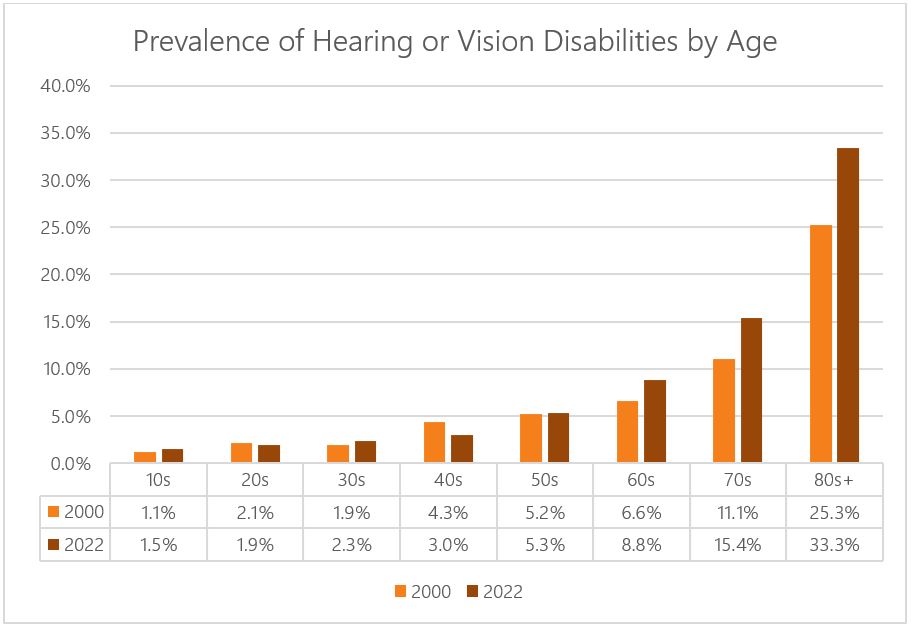
A key question to consider is why the prevalence of these disabilities has risen so notably over the past two decades. An obvious answer is the raw growth of older populations, who are more prone to these disabilities. But even within those populations, we see an increased incidence rate. The likelihood of these disabilities has risen notably among people aged 60 or older, as seen in the graph below. So not only does Colorado have more older adults, but those adults are more likely to report hearing or vision disabilities.

Our Conclusions
We would anticipate that the number of people with sensory disabilities would have increased due to raw population growth and the increase in the number of older adults. An interesting mystery to consider is why older adults are also more likely to report such disabilities in 2022 compared to 2000. We don’t have an answer in the data, but can identify a number of suspects. First and foremost, increases in insurance coverage over the past 20+ years may make people more likely to seek diagnoses. Second, the change in definition from “severe impairment” to “serious difficulty” may prompt more people to self-report these issues. Perhaps issues of the modern world such as screen time and urbanization have placed more burden on vision and hearing. Or maybe it’s just all that rock and roll in the 1960s and 1970s.
The Fine Print
As discussed in our post about changes in demographic analysis here, demographic data in the early years of Corona Insights was generally limited to the decennial census, which was conducted in the year 2000. Due to the detailed analysis in many of these posts, we are using analyses of raw data files that were produced from the 2000 Census data. Given that the U.S. Bureau of the Census updated and refined figures after these data were released, some of the data in our analysis may not precisely match the official 2000 figures. For example, the total population of the state was revised upward by approximately 1.2 percent after the raw data files were released. None of these differences are material in our conclusions.
Similarly, the most recent available raw data files are from the year 2022. Therefore, our 25-year analysis actually covers the time period from 2000 through 2022. The world of demographics sometimes requires compromises in the analysis. Such is life.
If you would like to reference this work, feel free to do so. However, please cite the source as Corona Insights and link to this blog post.