25 Years of Change – Physical Disabilities
11/19/24 / Corona Insights

As Corona Insights arrives at our 25-year anniversary, we’re looking back to see how our home state has changed over that time*. Included in this series are the following topics:
- Population and Age
- Citizenship Trends
- Sensory Disabilities
- Physical Disabilities (this article)
- Cognitive Disabilities
- Personal Care Disabilities
*Due to data availability the actual period examined in these posts is 2000 through 2022.

Photo by Nikhil Mistry on Unsplash
Measuring Disabilities
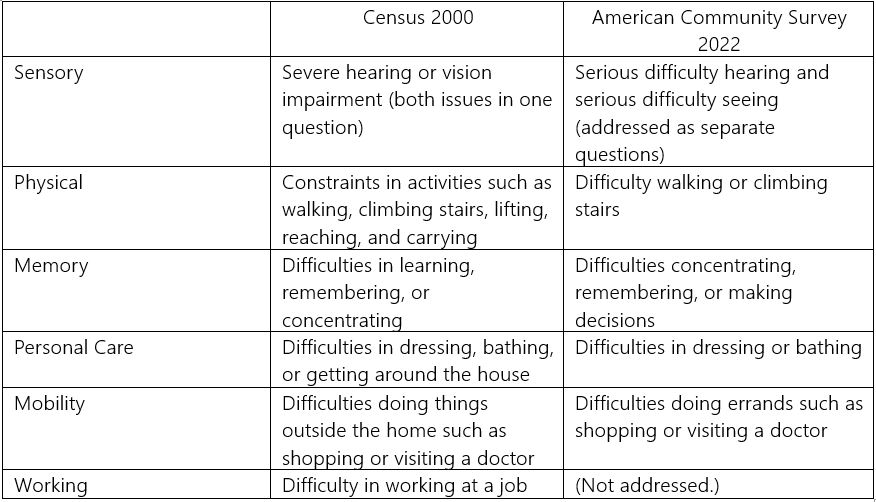
There are a number of ways to describe and report disabilities, and the US Bureau of the Census has revised their approach over the years. We can see the different methods below.

As we can see, there have been a few changes that require some latitude when comparing statistics over time. But the general themes remain consistent, other than removing the question about the ability to work. So let’s take a look at the trends we’ve seen in physical disabilities. Other blog posts will address other disabilities.
Measurements Over Time and Definition Changes
As noted above, physical disabilities were reported in 2000 and 2022 for people who had difficulty walking or climbing stairs, but in 2000 some other physical limitations were included in the definition: reaching, lifting, and carrying.
This difference in definitions makes a time comparison difficult. We have no current estimates on the prevalence of lift/carry/reach disabilities, and also cannot disaggregate the older data to assess how many people report disabilities lifting, carrying, or reaching versus difficulty walking or climbing stairs, or both.
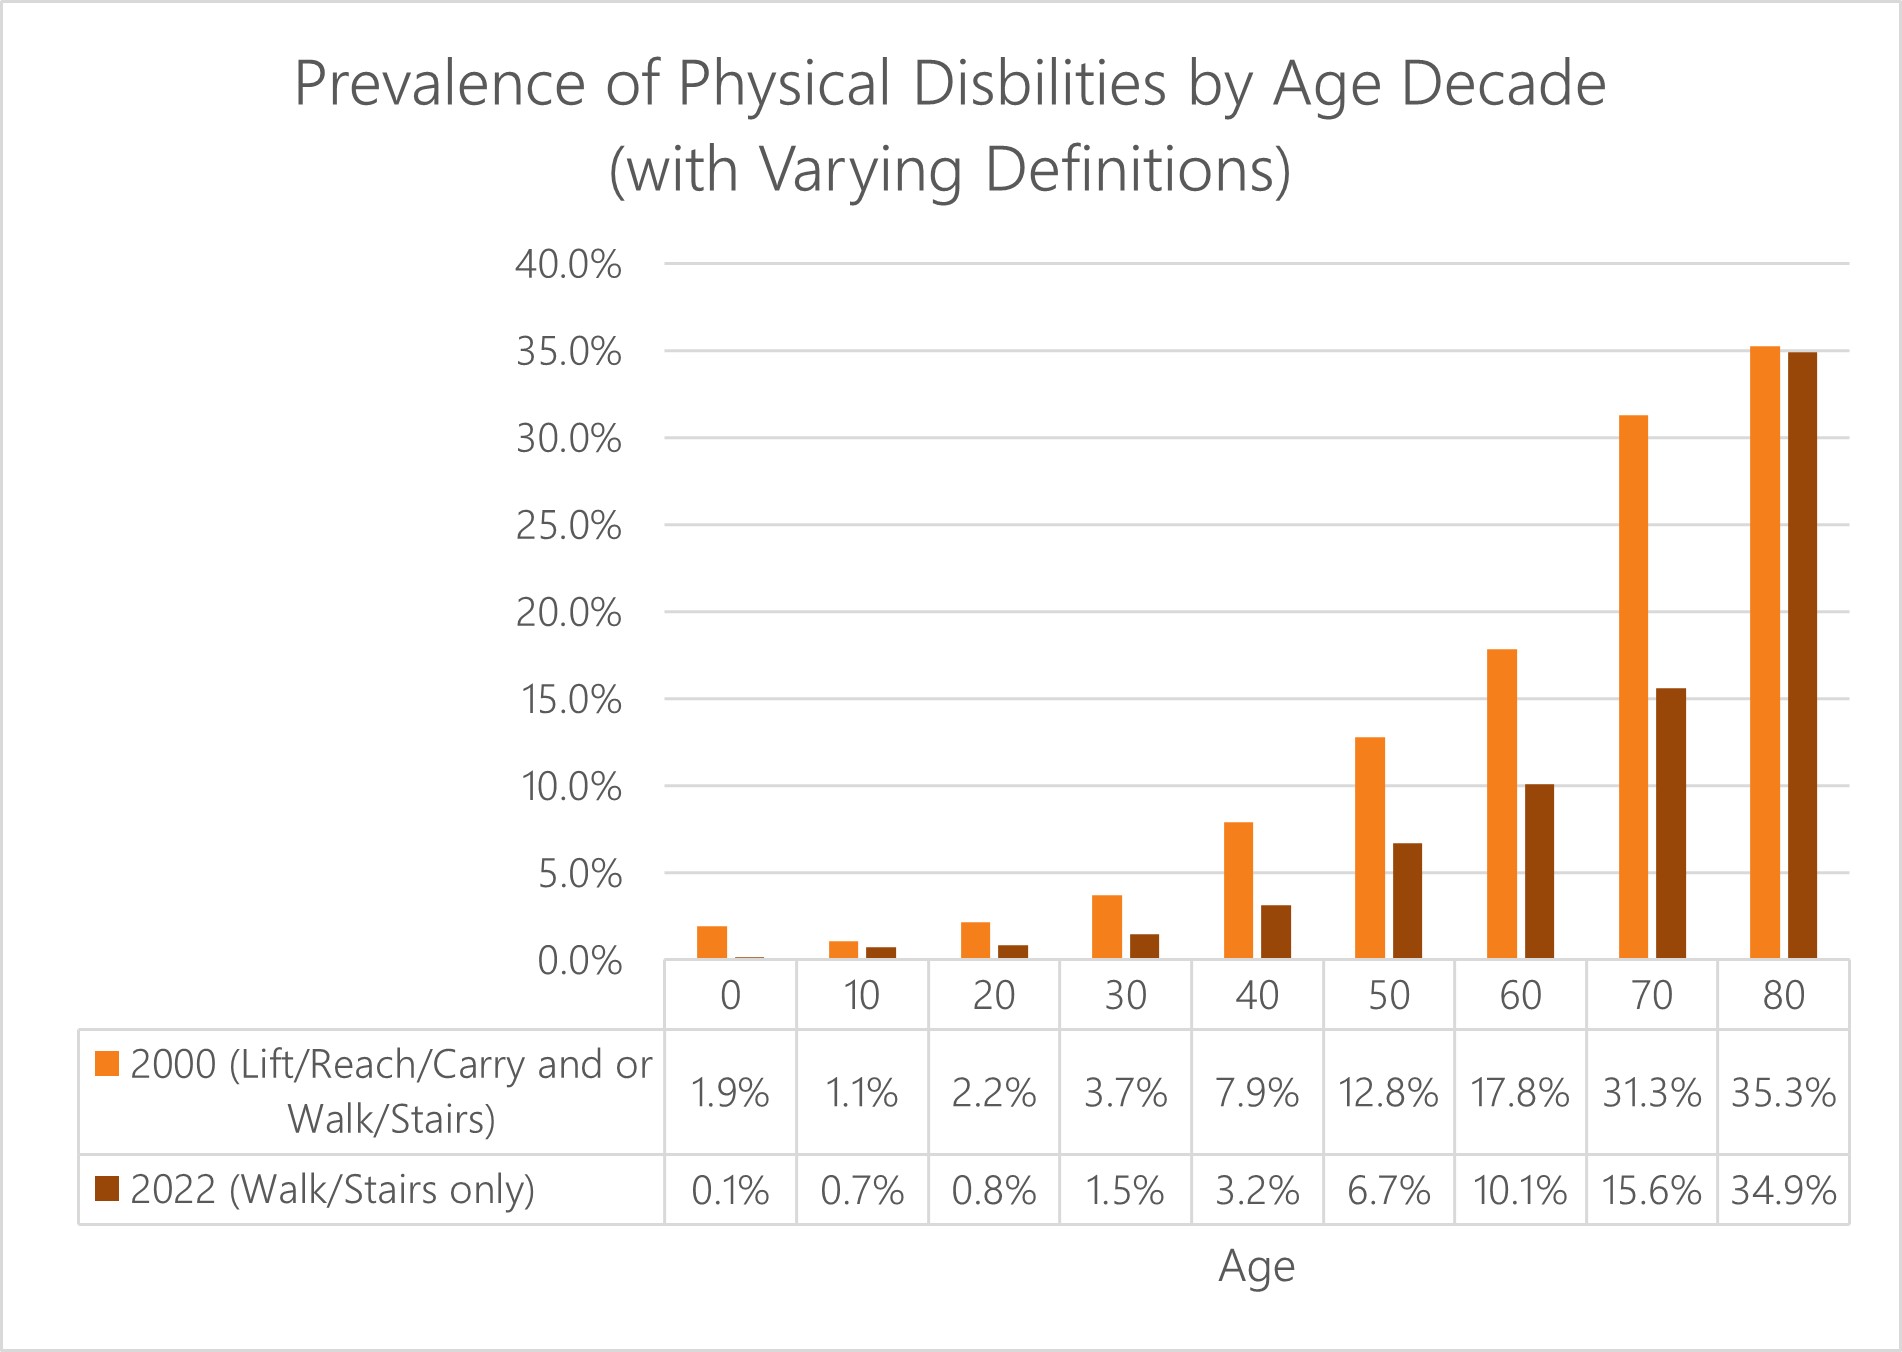
We cannot definitively prepare a comparison using the available data, but we can examine the prevalence of the two behaviors by age to perhaps gain a clue about trends.

In looking at the prevalence rates, we can see that the broader definition in 2000 produced much higher estimates of physical disability within each age group, up until people reach their 80s. At this point, one might theorize that those who have trouble walking tend to also have trouble lifting/reaching, and vice versa, so the difference in definition becomes less meaningful.
Below that age, the prevalence of physical disabilities in 2000 is more than double than the 2022 rate for most age categories below 50, and nearly double between the ages of 50 and 79. Despite advances in health care and insurance, it’s unlikely that walking difficulties have declined so notably in the past 22 years, so the difference is likely primarily attributable to difficulties in lifting, reaching and carrying. If this is the case, then we see that these activities, taken independently, are roughly as common as difficulties walking and climbing stairs.
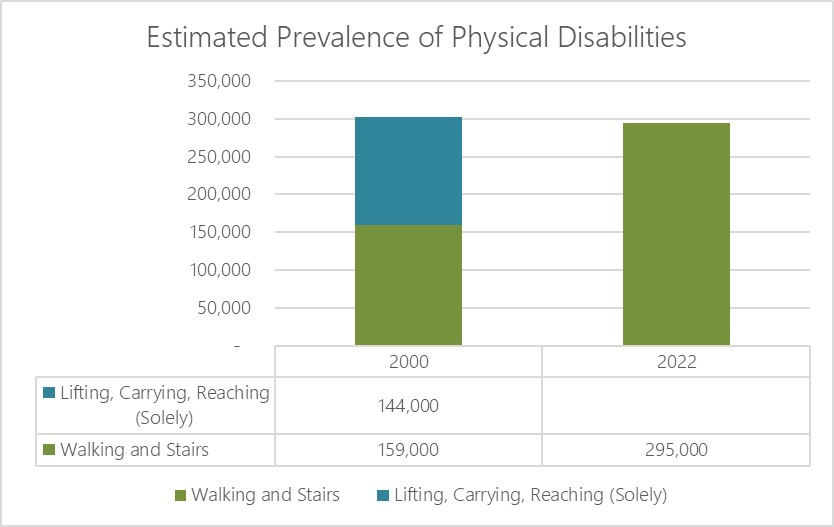
Overall numbers of residents with the reported disabilities are shown (or estimated) below. Applying the 2022 incidence of walking disabilities to the Year 2000, and also adjusting for the older population in 2022, we estimate that 159,000 people had difficulty with walking/stairs in 2000, recognizing that this estimate is probably overstated. So we can conclude that the walking/stairs disabled population has increased by over 135,000 people in the past two decades. We can subtract out the remainder of the disabled population in 2000 to develop a floor on the number of people who had lifting/reaching/carrying disabilities, but this would undercount that population since it doesn’t consider people who had both lifting/reaching/carrying disabilities and walking/stair disabilities.

Our Conclusions
Although we are limited in our analysis by changes in definition, our best estimate is that the number of people with physical difficulties climbing stairs and walking has likely come close to doubling over the past 22 years. This has implications not only for senior-specific issues such as in-home care, but also for the built environment where the streets and businesses are seeing more people with poor mobility.
Additionally, a large number of people likely have difficulty lifting/carrying/reaching, which is no longer included in the definition of “physical disability”.
The Fine Print
As discussed in our post about changes in demographic analysis here, demographic data in the early years of Corona Insights was generally limited to the decennial census, which was conducted in the year 2000. Due to the detailed analysis in many of these posts, we are using analyses of raw data files that were produced from the 2000 Census data. Given that the U.S. Bureau of the Census updated and refined figures after these data were released, some of the data in our analysis may not precisely match the official 2000 figures. For example, the total population of the state was revised upward by approximately 1.2 percent after the raw data files were released. None of these differences are material in our conclusions.
Similarly, the most recent available raw data files are from the year 2022. Therefore, our 25-year analysis actually covers the time period from 2000 through 2022. The world of demographics sometimes requires compromises in the analysis. Such is life.
If you would like to reference this work, feel free to do so. However, please cite the source as Corona Insights and link to this blog post.