25 Years of Change – Personal Care Disabilities
11/27/24 / Corona Insights

As Corona Insights arrives at our 25-year anniversary, we’re looking back to see how our home state has changed over that time*. Included in this series are the following topics:
- Population and Age
- Citizenship Trends
- Sensory Disabilities
- Physical Disabilities
- Cognitive Disabilities
- Personal Care Disabilities (this article)
*Due to data availability the actual period examined in these posts is 2000 through 2022.

Photo by Ginger Jordan on Unsplash
Measuring Disabilities
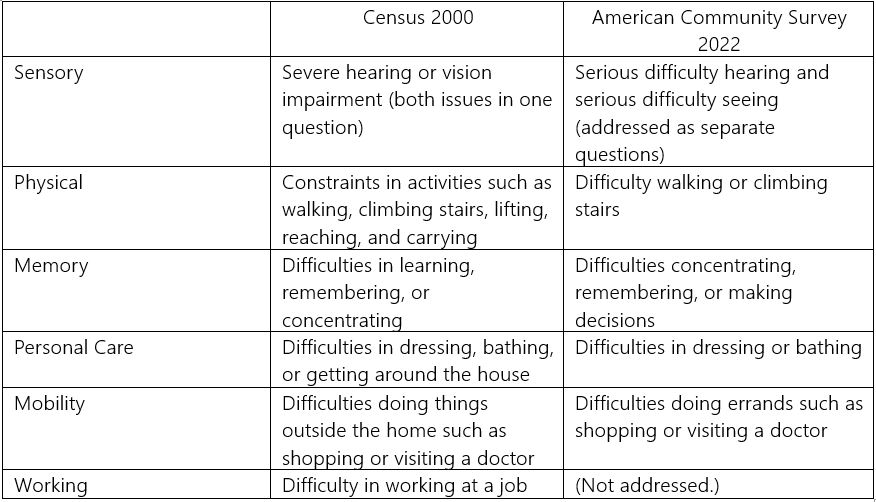
There are a number of ways to describe and report disabilities, and the US Bureau of the Census has revised their approach over the years. We can see the different methods below.

As previously mentioned, there have been a few changes that require some latitude when comparing statistics over time, but the general themes remain consistent. In our final post of the series, we take a look at the trends we’ve seen in personal care disabilities. See previous blog posts that address other disabilities.
Definition Change May Impact Results
As we can see above, the 2022 questionnaire removed the “getting around the house” difficulty while the other reported difficulties, dressing and bathing, remained the same. Because of this, one would expect that self-care disabilities would be more highly reported to some degree in 2000 compared to 2022.
Increases are Smaller than Expected
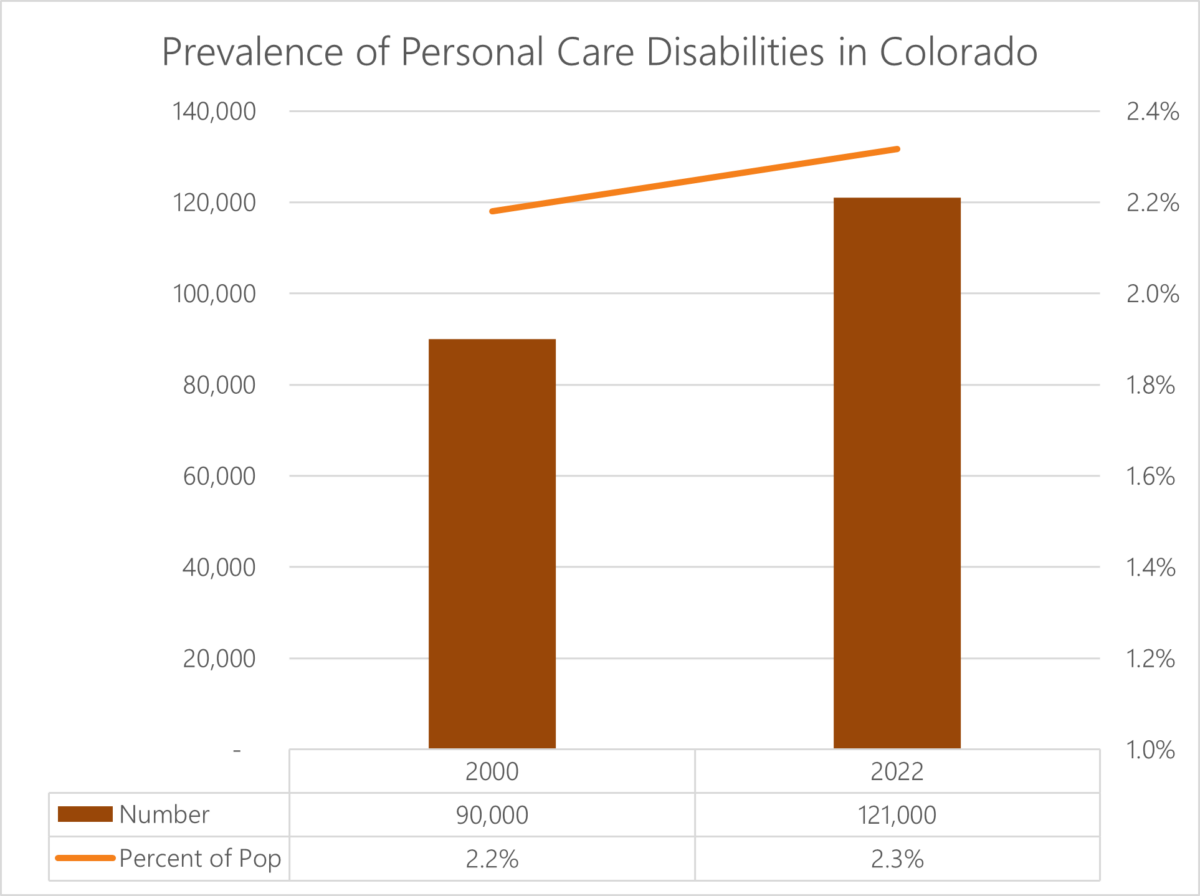
Due to population growth and aging, we would anticipate this disability to have increased over the past two decades, both in raw numbers and in prevalence. These two changes are both true, but are muted compared to increases in many other types of disabilities. This is quite possibly due to narrowing the definition.
The raw numbers of people with this disability have increased by roughly 34 percent, but that is slightly lower than the overall population increase of 37 percent during that time. Additionally, while the prevalence within the population has increased slightly, that increase has been lower than other types of disabilities. (Note: Changes in the age structure and the fact that this question doesn’t include children under the age of five can explain the seeming paradox of rising prevalence but slower growth than the overall population.)

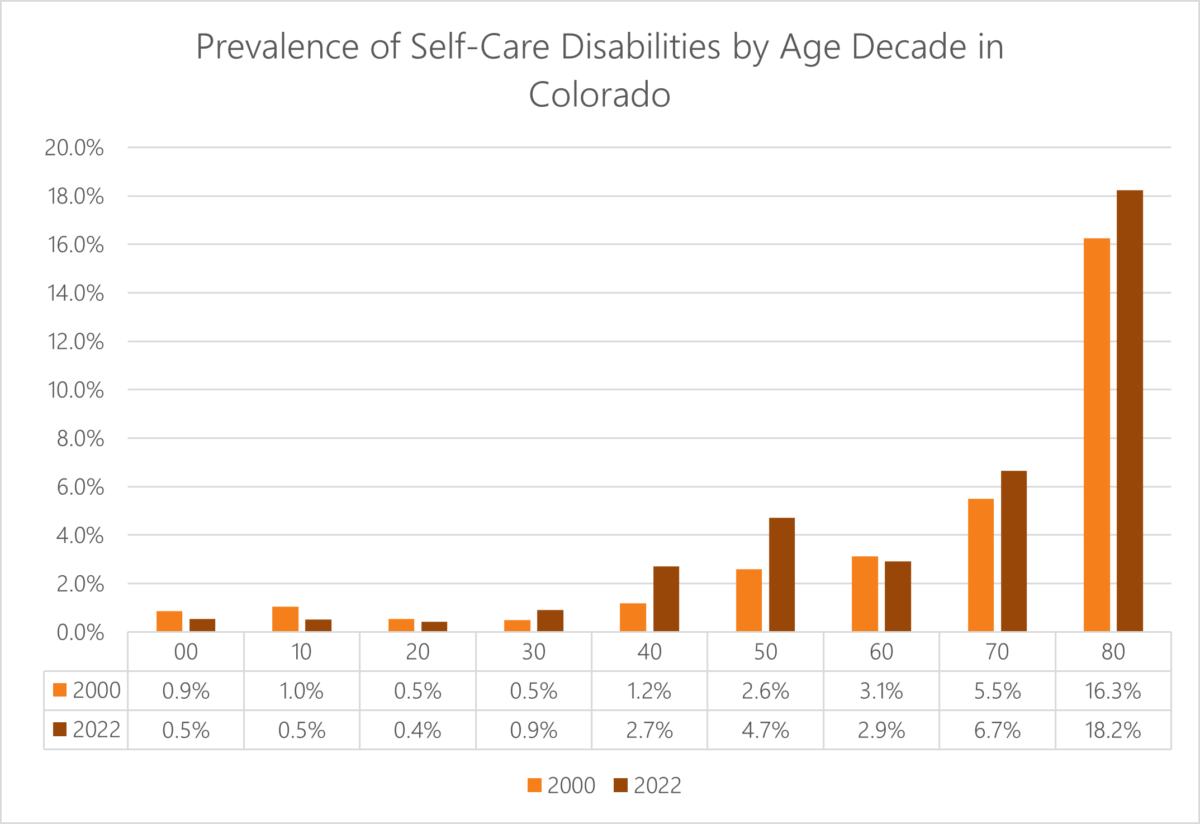
Let’s take a look at prevalence rates by age to see if we can draw some clues about these trends.
The pattern here is interesting. Prevalence rates have risen for all age groups over 30, with the exception of people in their 60s. Rates have notably increased among people in their 40s and 50s. However, these increases are somewhat dampened by decreases for all age groups under 30.

Our Conclusions
It’s difficult to draw strong conclusions from this data, other than to surmise that some factors are decreasing self-care disabilities among the younger population in Colorado. Perhaps this is due to technological innovations or increased availability of assistive devices or new medical techniques that younger people can leverage, or it could merely be a statistical oddity given the low prevalence rates. Regardless of the reason(s), the end result is a dampening of growth in the population that has self-care disabilities. This is notable in light of the fact that prevalence rates have increased among older populations even with a more narrow definition of the disability.
The Fine Print
As discussed in our post about changes in demographic analysis here, demographic data in the early years of Corona Insights was generally limited to the decennial census, which was conducted in the year 2000. Due to the detailed analysis in many of these posts, we are using analyses of raw data files that were produced from the 2000 Census data. Given that the U.S. Bureau of the Census updated and refined figures after these data were released, some of the data in our analysis may not precisely match the official 2000 figures. For example, the total population of the state was revised upward by approximately 1.2 percent after the raw data files were released. None of these differences are material in our conclusions.
Similarly, the most recent available raw data files are from the year 2022. Therefore, our 25-year analysis actually covers the time period from 2000 through 2022. The world of demographics sometimes requires compromises in the analysis. Such is life.
If you would like to reference this work, feel free to do so. However, please cite the source as Corona Insights and link to this blog post.