25 Years of Change – Citizenship Trends
11/7/24 / Corona Insights

As Corona Insights arrives at our 25-year anniversary we’re looking back to see how our home state has changed over that time*. Included in this series are the following topics:
- Population and Age
- Citizenship Trends (this article)
- Sensory Disabilities
- Physical Disabilities
- Cognitive Disabilities
- Personal Care Disabilities
*Due to data availability the actual period examined in these posts is 2000 through 2022.

Photo by Tudor Baciu on Unsplash
Most of Colorado’s Population were Born in the USA
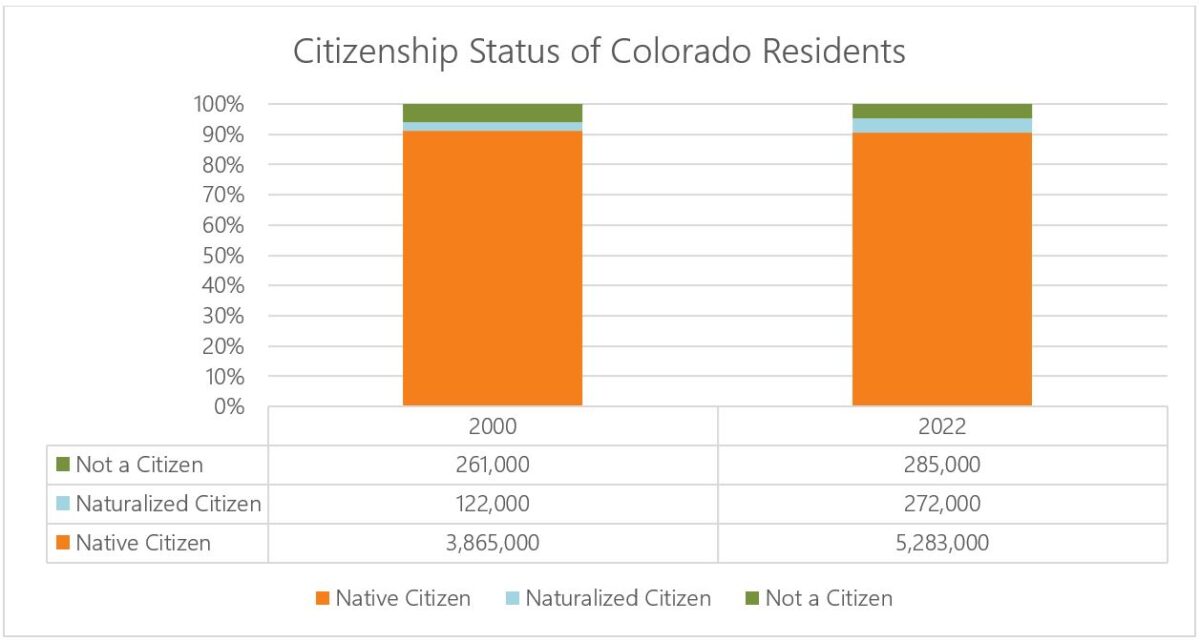
As one might expect, most Coloradans were born in the USA or its territories or were born to American parents overseas. (We refer to these categories collectively as ‘native citizens.’) This population accounts for 90 percent of Colorado’s residents. The remaining ten percent is equally split between non-citizens, who may have varying documentation statuses, and naturalized citizens, those born in other countries who have completed the formal process of becoming an American citizen.

Population Growth of Native vs. Naturalized Citizens
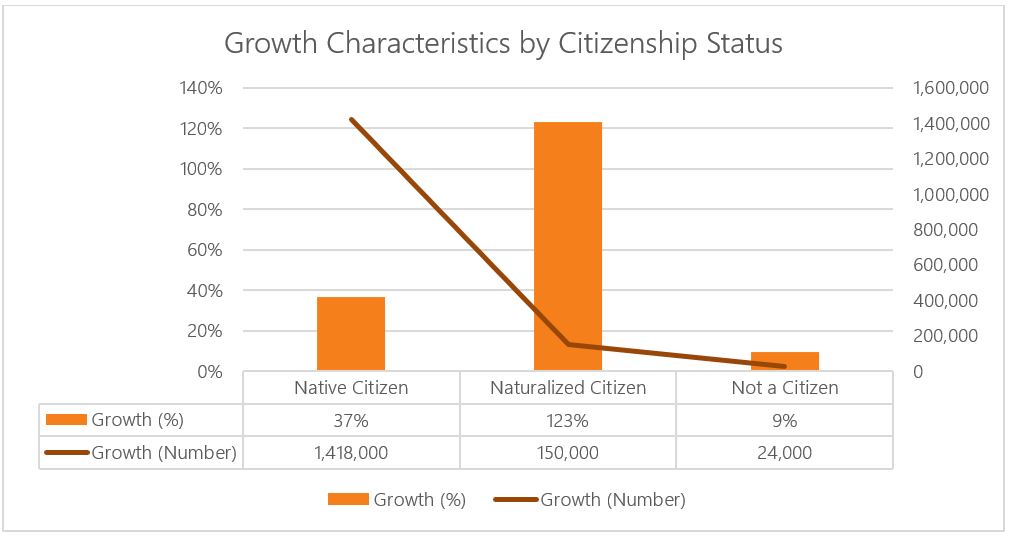
The naturalized citizen population has grown rapidly, more than doubling in the 2000-2022 time period. This could have many causal factors, which might include policy changes to promote citizenship or make the process easier, migration of naturalized citizens from other states, an increased desire among foreign-born populations to pursue citizenship, or other causes. Despite the rapid growth, the population remains small relative to the native citizen population.
The native citizen population has grown at a slower, but still strong, rate. This population has increased 37 percent over the 2000-2022 time frame. However, that accounts for over 1.4 million people, which is ten times more raw growth than we see among naturalized citizens. While the proportion of native citizens in the state has declined slightly from 90.9 percent in 2000 to 90.4 percent in 2022, we can see that both the population of Colorado and the growth of the population is dominated by this group.
The slowest-growing population segment in Colorado is the non-citizen population, which has increased by 9 percent over the 22-year period. This segment of the population has grown by 24,000 people, but given the higher growth of other segments, their share of the population has dropped from 6 percent to 5 percent. Of course, this population has an additional potential draining factor if non-citizens apply for, and receive, naturalized citizen status. Given the rapid growth of the naturalized citizen population, one theory is that non-citizens may be moving to naturalized citizen status in significant numbers.

Our Conclusions
While we hear significant public discourse and debate about immigration, it is worth noting that the growth in Colorado’s population over the past two decades is overwhelmingly from native citizens – either natural growth from those born in the state or those moving here from other states.
Immigrants are indeed rising as a proportion of the population, though that increase is small, amounting to half a percentage point over 22 years. Most of the immigrant growth has come from those who are, or become, naturalized citizens.
The Fine Print
As discussed in our post about changes in demographic analysis here, demographic data in the early years of Corona Insights was generally limited to the decennial census, which was conducted in the Year 2000. Due to the detailed analysis in many of these posts, we are using analyses of raw data files that were produced from the 2000 Census data. Given that the US Bureau of the Census updated and refined figures after these data were released, some of the data in our analysis may not precisely match the official 2000 figures. For example, the total population of the state was revised upward by approximately 1.2 percent after the raw data files were released. None of these differences are material in our conclusions.
Similarly, the most recent available raw data files are from the Year 2022. Therefore, our 25-year analysis actually covers the time period from 2000 through 2022. The world of demographics sometimes requires compromises in the analysis. Such is life.
If you would like to reference this work, feel free to do so. However, please cite the source as Corona Insights and link to this blog post.