The increasing prevalence of mixed methods research designs
1/31/20 / Jim Pripusich

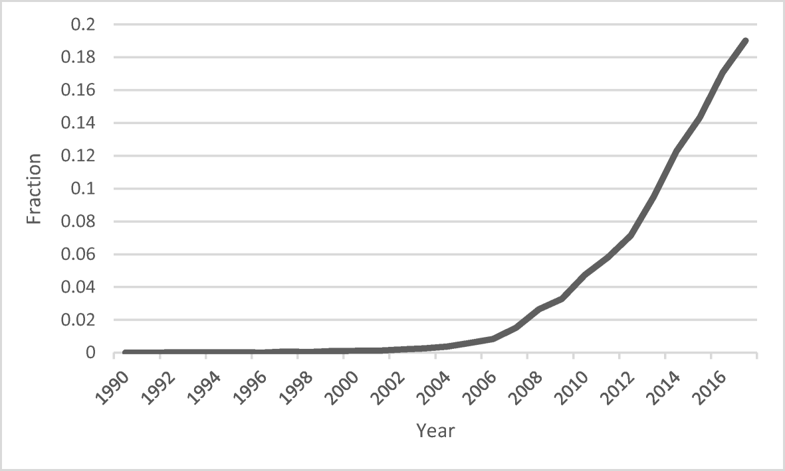
Conversations about research design often devolve into arguments about the relative merits of quantitative and qualitative approaches. One easy way to resolve these debates is to employ tools from both methods when answering the question at hand. Mixed methods research, or work that uses both qualitative and quantitative analysis, has become increasingly common in social and behavioral sciences over the last decade. As evident in the graph below, a rapidly growing share of abstracts mention mixed methods and Google’s NGram data (a count of a word’s instances across millions of scanned books) shows an 800% increase in the term “mixed methods” over a similar, 14 year period. Recent articles have highlighted a similar rise in popularity in market research, public health research, and ad testing.

However, there’s more to mixed methods than simply checking the boxes, as including both qualitative and quantitative elements to a project does not necessarily lead to better inferences. The key to an effective mixed methods approach is leveraging the strengths and weaknesses of these tools in an iterative process. Qualitative methods can provide an in-depth understanding of how a process works or how people think, feel, and behave, but cannot offer assurance of how prevalent these patterns are in the outside world. Alternatively, quantitative methods can give us rankings, levels, and percentages of phenomenon, but cannot tell us the deeper motivations or more intimate elements of why these patterns exist.
The conclusion of any inquiry always raises additional research questions. If the initial inquiry was quantitative in nature, it’s likely that most of these lingering questions would necessitate a qualitative design to be resolved as the available data is limited. The opposite often also holds true. Given this reality, iterative research designs where qualitative research is followed by quantitative follow-up studies, and vice-versa, are likely to yield better insights. Perhaps the best way to explain this process is through an example.
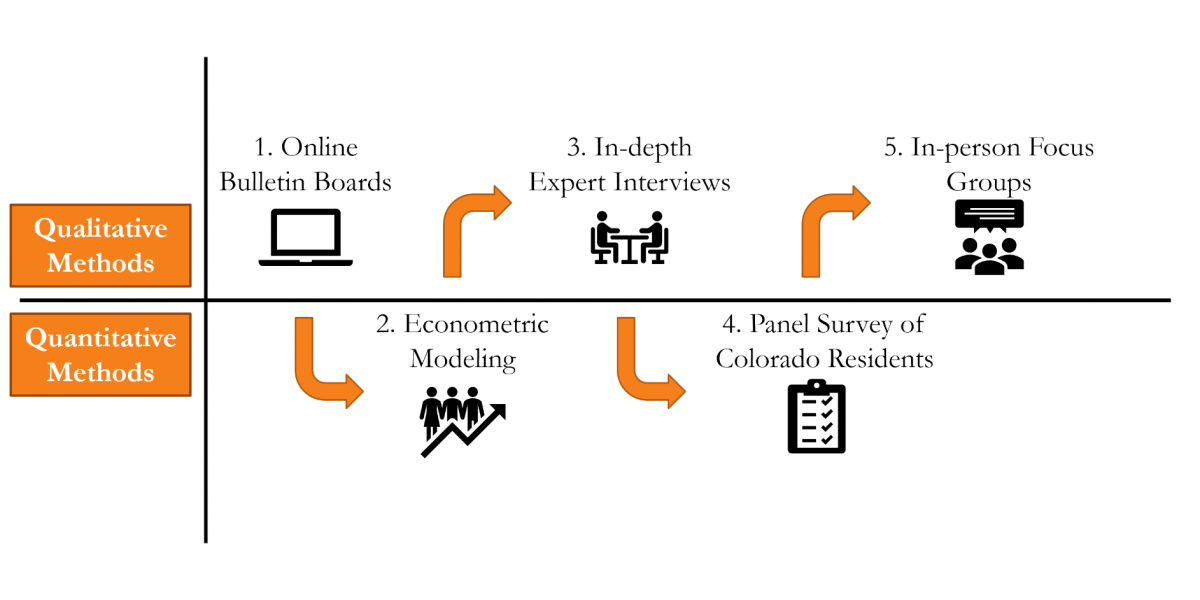
Over the past few months, Corona was retained by the Colorado Secure Savings Plan Board, a body created by the Colorado State Legislature that is comprised of members appointed by Governor Polis to study approaches to creating retirement savings. Our role was to explain why some individuals were saving more for retirement than others and to identify interventions that could increase individual retirement savings in the state. Our full report can be found here. Such a complex research goal lends itself to a mixed methods design. In order to tackle the task at hand, Corona employed a series of qualitative and quantitative tools. While elements were often overlapping, we took care to take lessons from each phase of this research to inform how we approached the design and execution of subsequent analysis. The figure below summarizes the component parts of our research.

The first research component of this project was a series of online bulletin boards, in which we identified some initial findings for how Colorado residents perceived saving for retirement, the difficulties they faced, and some gaps in financial education. Equipped with this knowledge, we analyzed data from the Federal Reserve and Consumer Financial Protection Bureau to assess how common these various difficulties and perceptions were on a national scale. Then, through econometric modeling we estimated effect sizes. For example, we were able to calculate how many more dollars an individual who visited a financial planner had in retirement savings, compared to someone who had not, while holding other behavioral and demographic variables constant. The quantitative follow-up provided confidence that what we heard was not an anomaly. These two components allowed us to gain an in-depth understanding of how people think and feel about retirement with a generalizable estimate of the prevalence and significance of these attitudes, traits, and behaviors.
While we were uncovering many pieces of the puzzle of what drives retirement savings behavior, we were also uncovering new, more complex questions our previous data were unable to answer. We brought these questions to financial experts and, through in-depth interviews, we were able to learn more about the process and psychology of retirement savings. It was only with this knowledge that we knew what specific questions needed to be included in the next phase of our research, a panel survey of Colorado residents. Here, we wanted to know to what extent the findings from our online bulletin boards existed statewide and how much the national patterns we identified applied to Colorado residents. Additionally, our expert interviews yielded new avenues for exploration and we collected data that were unavailable in the existing secondary sources that comprised our previous analyses.
Finally, as responses from the survey were recorded, we conducted three in-person focus groups across the state. This provided the opportunity to assess the extent to which the patterns we were seeing in our econometric models and survey data actually matched the lived experience and feelings of real Coloradans. In measuring abstract concepts in surveys, we inevitably truncate the complexities of life into categories and numbers. Having long-form conversation about these topics ensures that we are not losing the essence of what really matters in this process. We also used this opportunity to dig deeper into surprising patterns that emerged from our previous data analysis. Here, qualitative work can be used to explain why the patterns we see in quantitative analysis exist.
Each unique component of this research fed into the next, helping us identify the unique pieces of the bigger picture of retirement savings in Colorado. The complimentary nature of qualitative and quantitative analysis helps explain the rising popularity of mixed method approaches. As we contemplate the future of our work, we expect mixed method designs to be the norm.
