Is your Neighbor an Engineer?
2/13/15 / Matt Bruce
While Kevin has an engineering degree, I do not—my degree is in social sciences. After reading Kevin’s blogs about income patterns of folks with engineering degrees, I was inspired to take a fresh look at degrees from a spatial perspective. I wondered where engineers are most likely to live, where social scientists are likely to live, and is there is a relationship between them? What better place to explore than our own back yard.
Since Kevin and I both like maps, I pulled some data from the American Community Survey into our mapping software to take a look. The universe of this data is all adults, 25 years or older, who have obtained a bachelor’s degree or higher.
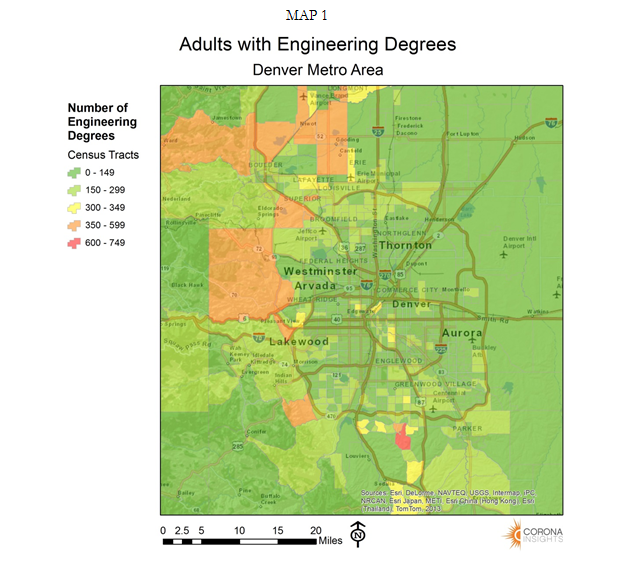
Interestingly, in terms of raw numbers, the census tracts with the greatest number of engineering degrees are on the south to northwest outskirts of the Denver area, especially around the Boulder area (see map 1). Maybe people with engineering degrees like to live near the foothills? Out of adults with a bachelor’s degree or higher in the Denver area, about eight percent have an engineering degree.
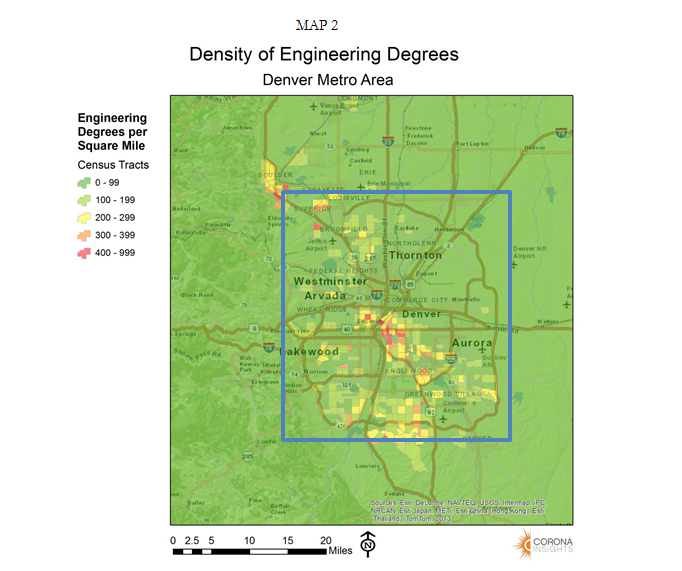
However, some of these census tracts are rather large, so I looked at the density of people with engineering degrees by tract (see map 2). When we look at the number of engineering degrees per square mile, we start seeing dense pockets in the heart of Denver and Boulder, but still some good representation in the Southern suburbs. In case you are curious, there is an average of 106 people with engineering degrees per square mile in Denver and its immediate suburbs (i.e., area within the blue box).
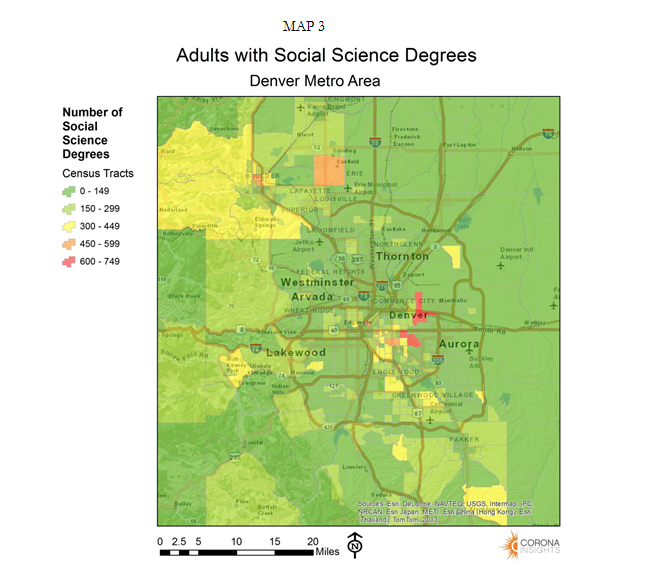
As I previously mentioned, I have a degree in social sciences, and I wanted to know if people with my degree were likely to live near people with engineering degrees? First, I mapped the number of social science degrees (see map 3). Around Denver, about nine percent of people with a bachelor’s degree have one in social sciences. By visually comparing Maps 1 and 3, I didn’t see any strong similarities in number of degrees by census tract. Social science degrees appear to be most numerous on the southeast and east side of Denver, with some in Boulder too.
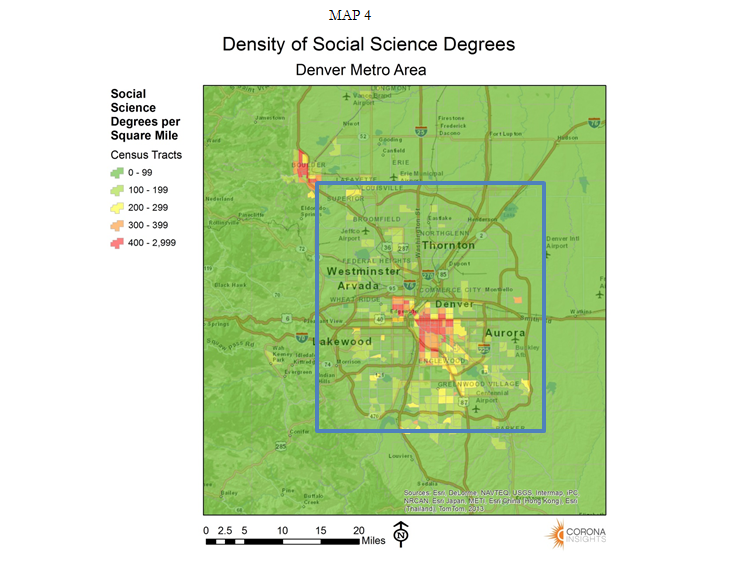
What about density of social science degrees? There is an average of 139 people with social science degrees per square mile in the Denver area (see map 4). We see some dense areas near downtown Denver, and I can visually start to pick out similarities between densities on maps 2 and 4. Remarkably, the census tract with the greatest density of social science degrees is just east of the Capital building. Considering this census tract is just a few blocks from our office, we seem to have a nice supply of potential labor nearby.
So what does this tell us? We know that, on average, there is a slightly greater proportion of people with social science degrees than engineering degrees (i.e., 9% vs. 8%), and there is a greater average density of social scientists than engineers. I guess engineers like room to spread their elbows and social scientists like to live near other people.
Are engineers likely to be neighbors with social scientists? When analyzed by raw number, there is a positive correlation between the two degrees. For about every one step up in the number of social science degrees by census tract, there is about a half-step up in the number of engineering degrees.
Does density play a role? It appears so. When looking at the relationship between degrees based on density (i.e., number of degrees per square mile), we see that the correlation is stronger than the correlation based on raw numbers of degrees. This means social scientists and engineers are more likely to live in the same census tract in dense urban areas than in rural areas.
Now that I’ve answered this question, its on to my next project where I aim to prove that my proximity to a doughnut shop has a positive and strong correlation with my personal happiness.
