A dose of data for your springtime allergies
6/6/14 / Beth Mulligan
 Like many people, I have “seasonal allergies.” March and April bring sneezing fits and foggy brain days for me. Often I get a sore throat and headaches. One year I went through three strep throat tests and a course of antibiotics before my doctor decided my swollen throat was caused by allergies.
Knowing you’re allergic to “something” isn’t all that helpful. Sure, you can keep antihistamines on hand and treat the symptoms as they arise, but you have no way to predict when symptoms will hit or minimize your exposure to the allergen.
A common first step in identifying the cause is to do a skin allergy test. Typically, this involves getting pricked in the back with approximately 20 solutions containing the most common allergens. The doctor marks off a grid pattern on your skin and each box gets pricked with one item and then you wait and see whether any of the pricked areas swell up or show other signs of allergic reaction.
I’ve had this done, but unfortunately (though not uncommonly) I didn’t react to any of the items tested. Which, doesn’t mean you’re not allergic to something, just that you’re not allergic to one of the things tested.
Research on myself hadn’t provided any usable information, so recently I turned to external data instead. Where I live, the city provides daily pollen counts for the highest pollen sources from about February through November. They don’t provide aggregated data, however, so I had to build my own database of their daily postings. In the part of town where I live, Ash, Juniper, and Mulberry are the most prevalent allergens during the time when my symptoms are greatest.
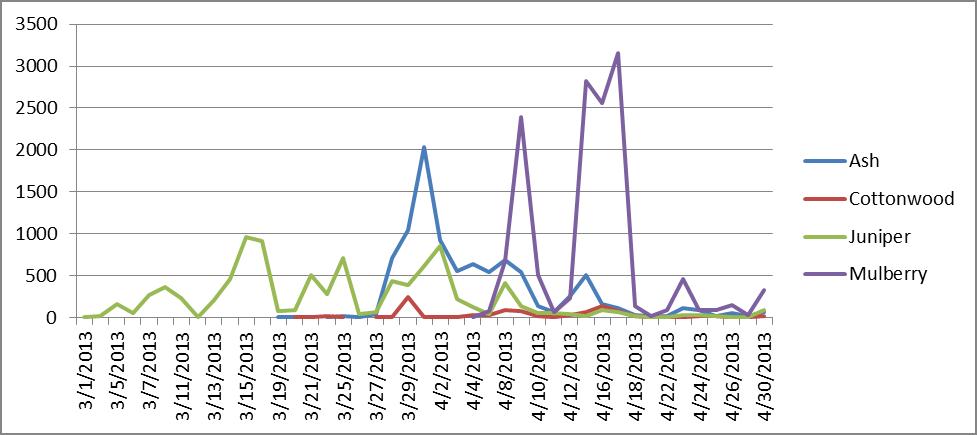
Last year, my worst day was April 1. Even with my allergy pills, I sneezed the entire day. Here’s what the pollen count showed for my area of town during that time:
Ash pollen counts peaked on April 1. Juniper and Cottonwood were also relatively high, but Juniper had been fairly high for weeks without me having corresponding symptoms.
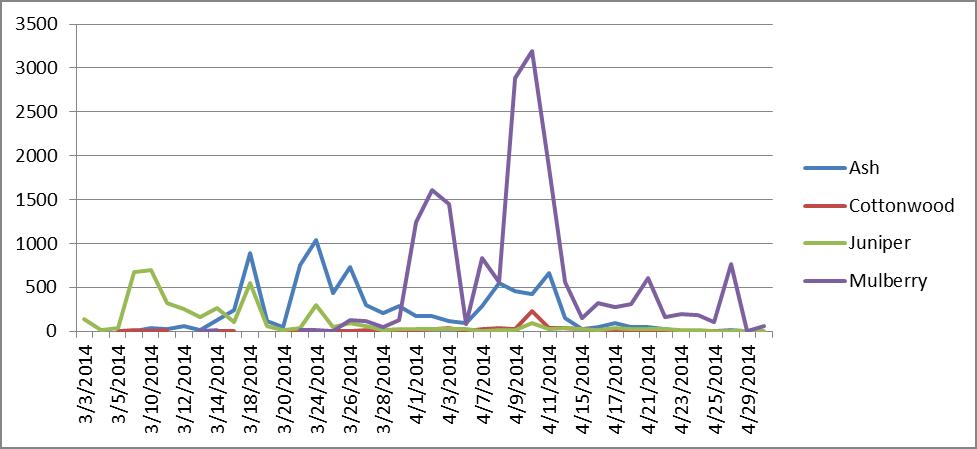
This year, my allergies were not so bad at all. I was out of town for a week in mid-March and for two separate weeks in early and mid-April, which certainly helped, but I only had a few foggy-brain days in late March and mid-April. The pollen counts for this year:
Ash was lower overall compared to the previous year, and once again seemed to line up best with my symptoms. This is a correlational analysis, so it doesn’t provide a definitive diagnosis, but because different allergens peak at different times, it offers some ability to rule out other things. And it’s more efficient (and painless!) compared to the skin test.
Armed with this information, I did some additional research on the predominant types of Ash trees where I live (Modesto and Green Ash), and the geographic range for those species. If I’m planning to travel to Ash-free zones, I can try to schedule those trips for the spring. And otherwise, I can keep an eye on the pollen counts and try to stay inside with the windows closed when Ash counts are particularly high.
It’s not perfect data, but like most tough decisions, we have to do the best we can with limited data and our powers of educated inference. Hopefully less sneezing awaits!


