How to make sense of open-ended responses
3/20/14 / Sarah Williams

As we’ve pointed out before, including an open-ended question or two on a survey can be incredibly enlightening. After all, these kinds of questions really bring the attitudes and beliefs of respondents to life and leave the researcher with a rich pool of genuine opinions on a topic. However, open-ended data can sometimes present an analytical challenge – just how do you make sense of all of these unique answers? As it turns out, there are several options when it comes to analyzing data from open-ended questions, outlined below.
Do nothing. There is always the option to not do anything with open-ended responses. Of course, it is certainly a best practice to review all of the open-ended responses to a question just to get a sense of what folks are saying. However, if open-ended questions yield little more insight than the closed questions within a survey or if there aren’t any clear trends in the data, a formal analysis may not be warranted. This might happen with surveys that have small samples or with data that is elicited from answer options such as “Other (please specify)”.
Coding. Probably one of the most commonly used approaches to understanding open-ended responses is to code them. While there are some software options available that can offer computer assistance to code and analyze open-ended responses, we manually code this data ourselves at Corona in order to ensure accuracy and consistency. As a first step, we read through responses so that we can get to know the data and see some of the trends that emerge. Then, we develop a set of codes or “buckets” for these different trends, re-read through each response, and assign the codes accordingly – sometimes even applying more than one code to a single text response. By doing this, we can make sure that we’re identifying clear trends, issues and ideas suggested by respondents. Once we’re done applying the codes, we can then quantify these different categories and see how often each of them emerged in the data.
Sentiment analysis. Another option for analyzing open-ended data is to determine the attitude or inclinations of a participant based on the “sentiment” or “feelings” embedded in their response text. Again, this can be done using software or manually. One frequently used approach for this type of analysis is to determine the polarity of a certain response – in other words, is it positive, negative or neutral? For example, we might use sentiment codes to categorize the following responses :
– “It was a great restaurant with amazing service.” – Code: Positive
– “I had a terrible dining experience at the restaurant.”- Code: Negative
– “I ordered a pizza at the restaurant.” – Code: Neutral
Although it is important to realize that sentiment analysis (like coding, above) can be subjective, this approach provides a relatively straightforward and efficient approach to understanding the general nature of responses.
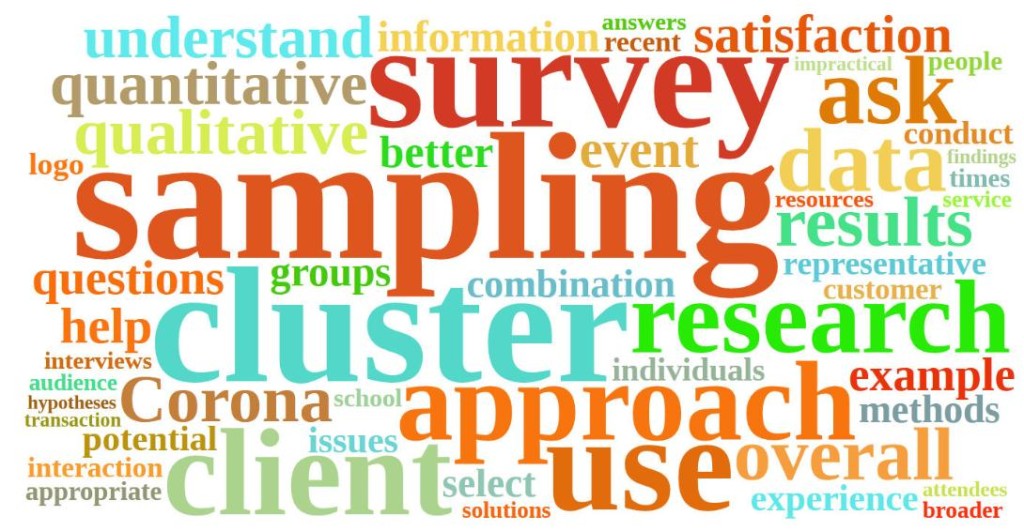
 Word clouds. A fun way of making sense of open-ended data is to create a word cloud, which allows the researcher to quickly visualize common words and themes from qualitative feedback. There are several different ways a word cloud can be created, and they all can help a researcher see the bigger picture when it comes to open-ends. One popular method compiles a word cloud based on word frequency. The more often a particular word appears in the data results of a particular question, the larger the word will appear in a word cloud. I created a sample cloud of this sort using text from Corona’s February Radiance blog posts. Clouds can also be created from “tags” that a researcher applies to different words in open-ended responses, much like the coding described above. Again, the more often a tag occurs, the larger it is displayed in the word cloud.
There are some important considerations to keep in mind when choosing to use a word cloud for open ended analysis. For example, some words that are similar will show up separately in a cloud, such as “Texas” and “TX.” Also, if some words aren’t kept together, they can lose their meaning (e.g., seeing the words “not fun” in a word cloud is different than seeing “not” and “fun” separately).
Overall, although open-ended questions can have their disadvantages (e.g., time, cost, etc.), we know that they can provide a wealth of information and help tell a story behind the data. The key is to integrate open ends in a meaningful and strategic way when a survey is designed. As Dave said in his last blog post: better insights start with better data that start with better design.